Christina Sewall
GIS Portfolio
Cartography and Data Processing

Map of Elementary Middle and High Schools in Ward 7, Washington DC with insert map. Use of Gestalt's Principles of visual hierarchy, contrast, figure-ground relationship, and balance.

Map that focuses on spatial relationships within a dataset, identifies patterns, and deplores trends in the data

Four methods of classifying data to show the percentage of people over 65 in Escambia County, FL.
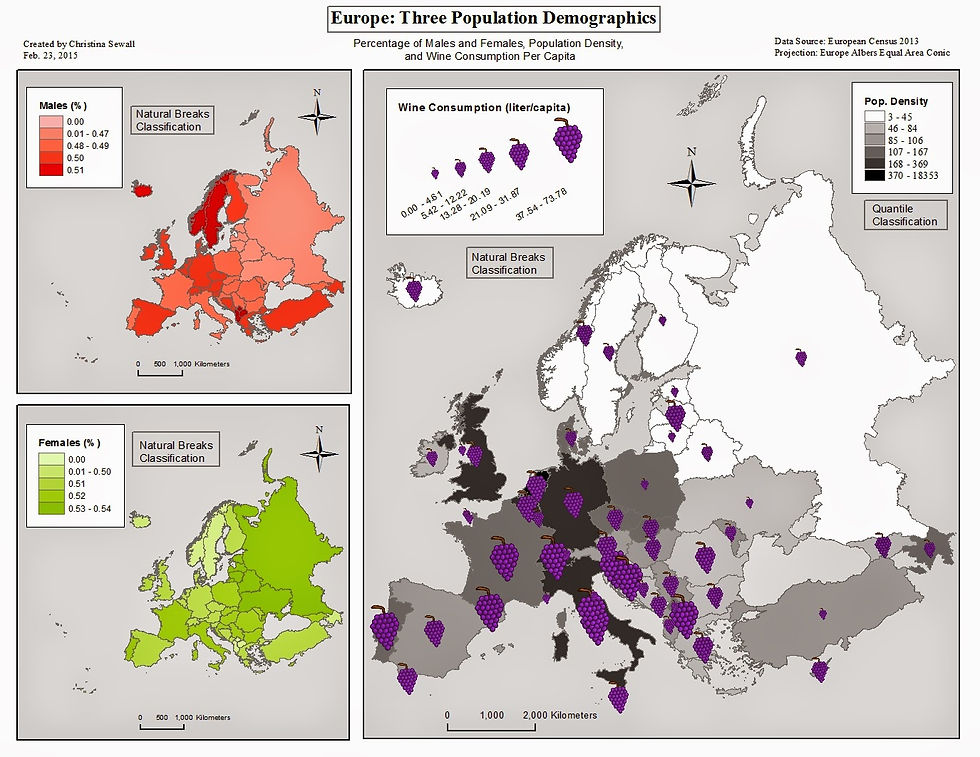
Classification for population density, % of males, % of females, and wine consumption per capita.

Use of the Spaital Analyst Tool to show annual precipitation in Washington State.

Use of a formula in Excel to find proportional width of each flow line based on the number of immigrants coming from each region - visually represents not only direction of movement, but also number of people moving.

This map uses raw total data to display distribution patterns.

Conversion of 2D features to 3D features using data gathered from LiDAR.

Two sets of data presented in one map; graduated symbols and graduated colors